three linked trisections of a hexagon
large-scale woodblock print, steamroller assisted
adam rowe · three linked trisections of a hexagonlarge-scale woodblock print, steamroller assisted

three linked trisections of a hexagon
large-scale woodblock print, steamroller assisted
if u rly θink about it nihilism is just secularized judaism in decline 
(also yes, "nietzschebrot" is a real term now, because I am using it 𓅱)
#FractalFriday (It's already Saturday)
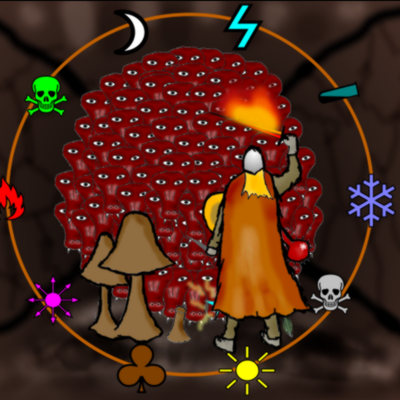
Elephant valley of the Mobius Mandelbrot set.
Formula: \(z_{n+1}=f(z_n^2+c,1)\)
where \(f(z, a)\) is defined as (C-like pseudocode):
Complex f(Complex z, Real a) {
Real dist = abs(re(z)) - a;
if (re(z) > a) {
re(z) = -a + dist;
im(z) = -im(z);
} else if (re(z) < -a) {
re(z) = a - dist;
im(z) = -im(z);
}
return z;
}
Coloring is done by using three very similar colormaps, mapped to triangle inequality average values.
The final color is produced by interpolating between these three colors using the so called "atom domains".
Generated using my GLSL Shadertoy fractal generator: https://www.shadertoy.com/view/33sSRf
Look at my new sketch on #openprocessing, ColourCurtain.
https://openprocessing.org/sketch/2695752
The items' colours are altered resulting from the counter value mod 3; thus, only one of the three colour channels is changed, causing the effect of an irregular colour gradient.
Try out generating more pattern by reloading the page.
Here’s a video of the Okimate 20 printing Rule 30 full width this time.
Rule 30 on a vintage Okimate 20 thermal printer.
With thanks to @MadeleineS for the inspiration.
Mathematik Rätsel: Was ist die Lösung? 
a × b = 15
+ +
c - d = 5
= =
3 12
a = ?
b = ?
c = ?
d = ?
New free pattern on Ravelry:
https://www.ravelry.com/patterns/library/pixie-square
The Pixie Square is a new type of crochet granny square designed for detailed, high-complexity, pixellated motifs. (Great for mathematical patterns!)
4d shapes
9d colors
"The Great Splash". Based on the golden ratio.
#fractal #mathart #algorithmicArt #GoldenRatio
I reused the paper from Solar Crown (David Martinez) to make Estrella de Origami Mimi by Keila Correa, instructions in video by YoshiYoshi https://www.youtube.com/watch?v=QJlgJeHE_UI
A pleasing modular @origami model using only four folds for each unit.
Ulugh Beg Observatory Museum, Samarkand, Uzbekistan
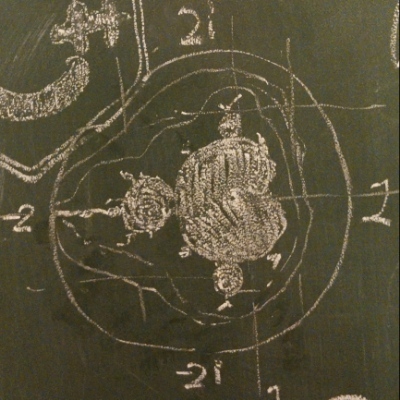
The Nilgeometric Geodesic Cone in horizontal view
Solar Crown by David Martinez, taught by Caryn Lum at Greater San Diego @Origami Group Virtual Folding Fun https://origamiusa.org/calendar
Original video instructions https://www.instagram.com/p/DLaOcllu490
And here is the same visualization style applied to two other map projections.
Equirectangular keeps the scale constant on the equator and meridians. But the squares close to the poles are stretched.
Gall-Peters preserves the relative areas. The poles are even more stretched.
While the Mercator projection fails to preserve the relative sizes, it does map squares to (almost) squares, which made the Mercator visualization look very nice.
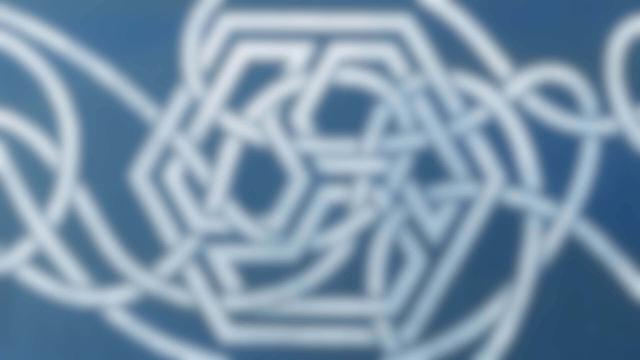
I _think_ this is all simple paths on a 4x3 rectangular lattice, up to symmetry (including swapping start and end.)
But it took me long enough to get the symmetry conditions right that I should probably double-check by enumerating them w/o symmetry and then compute the orbits directly.
A yet another visualization of the distortions of the Mercator projection.
An ASCII map using the Mercator projection is projected back on a sphere. In the map, all the characters are of the same size.
More detailed assembly instructions.
This origami model belongs to a genre known as ‘Planar Modular Origami’ https://www.britishorigami.org/product/65-planar-modular-origami-david-petty/
https://www.giladorigami.com/origami-database-book/4021/Planar-Modular-Origami-by-David-Petty has photos of some of the models in the book


 - 太陽動物園